


Can share market investors predict the future?
- Aug 15, 2025
- 6 min read
Volatility indexes are a barometer for where share markets may be heading
It should come as no surprise that there isn’t an accurate way to foretell what share markets will do from one day to the next.
Yet, while there is no share market crystal ball as such, there are dozens of market indexes globally that are designed to measure expected volatility for different asset classes, regions, or securities including individual shares.
These volatility indexes – some of which are tradeable on different share markets via specialist exchange traded fund (ETF) products – are forward-looking barometers that can be used as a way of gauging investors’ sentiment about the future.
Below are some of the share market volatility tracking indexes, including Australia’s own volatility index, that many traders and investors follow.
Warning for information that follows: Past performance information is given for illustrative purposes only and should not be relied upon as, and is not, an indication of future performance.
All investments are subject to risk, including the possible loss of the money you invest. Be aware that fluctuations in the financial markets and other factors may cause declines in the value of your account.
The U.S. fear index
Arguably the most widely known measure of investors’ volatility expectations is the VIX – the Chicago Board Options Exchange’s CBOE Volatility Index – which is often referred to as the U.S. markets’ “fear index”.
The VIX is a real-time tradeable index that tracks the magnitude of price changes on options contracts covering the United States’ S&P 500 Index which are due to expire within the next 30 days. Large price swings in expiring options contracts, either up or down, indicate expectations of greater volatility in the S&P 500 Index.
If the VIX is at 20, it means the market expects annualised volatility of 20% over the next 30 days.
A higher VIX reading is indicative that investors expect increased market uncertainty, while a lower reading indicates expectations of lower U.S. market volatility.
The VIX surged to an intraday high of 60.13 on 7 April on the back of a largely unanticipated downside risk—the broad U.S. tariff announcements of 2 April. This marked the highest reading for the index since the onset of the COVID pandemic in March 2020, when it spiked to 82.69, although this level was still below the all-time intraday high of 89.53 recorded during the Global Financial Crisis in October 2008.
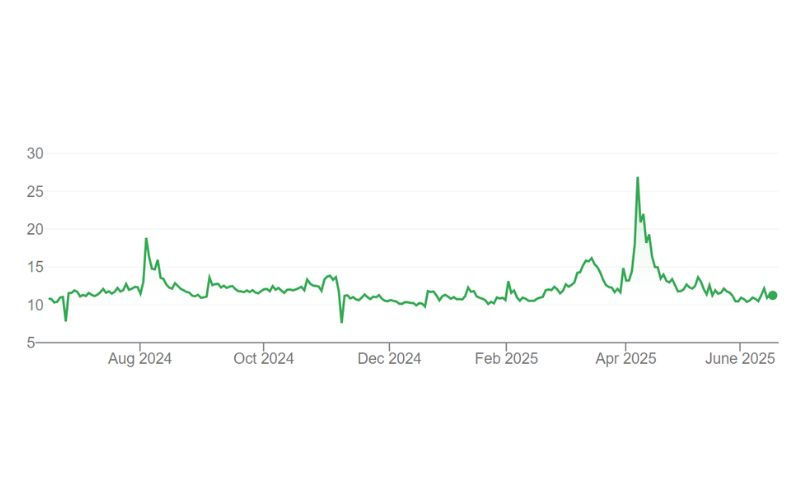
How the VIX has moved over the last year

Note: CBOE Volatility Index 17 June 2024 to 17 June 2025.
Source: Chicago Board Options Exchange.
Australia’s volatility index
The key market sentiment indicator for the Australian share market is the S&P/ASX 200 VIX (A-VIX).
It uses a similar calculation methodology to the VIX, tracking the price volatility of options covering the S&P/ASX 200 that will expire over the next 30 days.
Relatively higher levels of the A-VIX imply a market expectation of large changes in the S&P/ASX 200, while a relatively lower A-VIX value implies a market expectation of little change. As a result, the A-VIX will often move inversely to the equity market.
The A-VIX has followed a very similar path to the U.S. VIX over time, including in early April when the Australian share market also experienced volatility as a result of uncertainty around U.S. trade tariffs.
The A-VIX has largely mirrored the U.S. VIX
Note: S&P/ASX 200 VIX 17 June 2024 to 17 June 2025.
Source: Australian Securities Exchange.
The Skew Index
The CBOE Skew Index is a volatility indicator that also tracks options trading on the Chicago Board Options Exchange and is used as a pointer to so-called “Black Swan” events — difficult to predict situations that have the potential to trigger a market correction.
When there’s more buying of downside protection options, the Skew Index indicates that traders are covering off their positions against a potential market downturn.
A high Skew Index suggests that traders are seeing increased risk of a major market downturn. At current levels the Skew Index is trading at a level that suggests traders expect moderately low volatility over the shorter term when compared with earlier in the year and the latter part of 2024.
The Skew reflects the positions traders are taking

Note: S&P 500 Skew Index 17 June 2024 to 17 June 2025.
Source: Chicago Board Options Exchange.
Does tracking market volatility matter?
Indexes that measure projected volatility are useful to a point. They can’t accurately predict future market movements, but they can be used a barometer because they indicate market trading sentiment.
For long-term investors, however, short-term sentiment around volatility and near-term returns should be largely irrelevant.
Historical markets data shows that while volatility can impact returns over the short term, short-term volatility generally has had little impact on long-term returns.
That’s clearly illustrated in the index chart below, which covers the period between 1 May 2015 and 30 April 2025 and shows how a starting balance of $10,000 would have changed in value after being invested into different asset classes.
This period of time includes the 2020 COVID market crash and the more recent market volatility.
The numbers in the chart represent total investment returns. That is, they assume all investment income earned from an investment fund over time was reinvested back into units in the same fund. The returns numbers also exclude any acquisition costs, fees and taxes.
Taking a long-term view
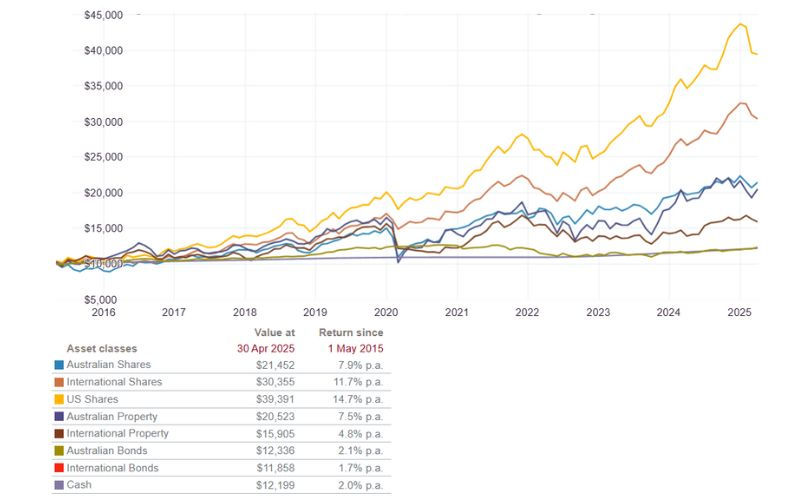
Sources: Australian Bureau of Statistics, Bloomberg Finance L.P., Melbourne Institute of Applied Economic & Social Research, MSCI Inc., Standard & Poor’s, WM Reuters. Notes: 1. Per annum total returns to 30 April 2025. 2. S&P 500 Total Return Index (in AUD). 3. S&P/ASX All Ordinaries Total Return Index. 4. MSCI World ex-Australia Net Total Return Index AUD Index. 5. S&P/ASX 200 A-REIT Total Return Index. 6. Bloomberg AusBond Composite 0+ Yr Index. 7. Bloomberg AusBond Bank Bill Index. 8. Interest rate is the Reserve Bank of Australia’s Official Cash Rate. All figures are in Australian dollars. All marks are the exclusive property of their respective owners.
While returns across asset classes have varied considerably, investors who have held their investment course over the long term have managed to achieve capital growth and income returns thanks to the combination of markets growth and investment compounding.
Markets volatility can be distracting and unsettling for some.
But successful investing revolves around having a well-planned and diversified strategy that’s aligned to your specific goals, and the discipline and resolve to stay the course, even during volatile investment periods.
This article has been reprinted with the permission of Vanguard Investments Australia Ltd. Copyright Smart Investing™
As previously stated: Past performance information is given for illustrative purposes only and should not be relied upon as, and is not, an indication of future performance.
All investments are subject to risk, including the possible loss of the money you invest. Be aware that fluctuations in the financial markets and other factors may cause declines in the value of your account.
GENERAL ADVICE WARNING
Vanguard Investments Australia Ltd (ABN 72 072 881 086 / AFS Licence 227263) (VIA) is the product issuer and operator of Vanguard Personal Investor. Vanguard Super Pty Ltd (ABN 73 643 614 386 / AFS Licence 526270) (the Trustee) is the trustee and product issuer of Vanguard Super (ABN 27 923 449 966).
The Trustee has contracted with VIA to provide some services for Vanguard Super. Any general advice is provided by VIA. The Trustee and VIA are both wholly owned subsidiaries of The Vanguard Group, Inc (collectively, “Vanguard”).
We have not taken your or your clients' objectives, financial situation or needs into account when preparing our website content so it may not be applicable to the particular situation you are considering. You should consider your objectives, financial situation or needs, and the disclosure documents for the product before making any investment decision. Before you make any financial decision regarding the product, you should seek professional advice from a suitably qualified adviser. A copy of the Target Market Determinations (TMD) for Vanguard's financial products can be obtained on our website free of charge, which includes a description of who the financial product is appropriate for. You should refer to the TMD of the product before making any investment decisions. You can access our Investor Directed Portfolio Service (IDPS) Guide, Product Disclosure Statements (PDS), Prospectus and TMD at vanguard.com.au and Vanguard Super SaveSmart and TMD at vanguard.com.au/super or by calling 1300 655 101. Past performance information is given for illustrative purposes only and should not be relied upon as, and is not, an indication of future performance. This website was prepared in good faith and we accept no liability for any errors or omissions.
Important Legal Notice - Offer not to persons outside Australia. The PDS, IDPS Guide or Prospectus does not constitute an offer or invitation in any jurisdiction other than in Australia. Applications from outside Australia will not be accepted. For the avoidance of doubt, these products are not intended to be sold to US Persons as defined under Regulation S of the US federal securities laws.
© 2025 Vanguard Investments Australia Ltd. All rights reserved.
Comments